Viewing a remotely sensed image draped over a terrain surface can often lead to greater understanding of the patterns in the image and how they relate to the shape of the earth's surface.
Imagine that you're a geologist studying Death Valley, California. You have collected a TIN that shows the terrain and a satellite radar image that shows the roughness of the land surface. The image is highly informative, but you can add a dimension to your understanding by draping the image over the terrain surface. Death Valley image data was supplied courtesy of NASA/JPL/Caltech.
Turning on the 3D Analyst extension
First, you'll need to enable the 3D Analyst extension.
Steps:
- Start ArcCatalog by clicking Start > All Programs > ArcGIS > ArcCatalog 10.
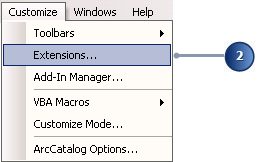
- Click Customize and click Extensions.
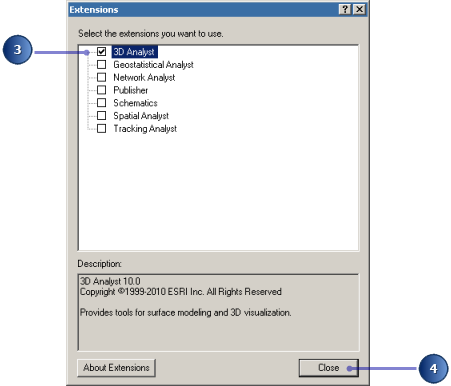
- Check 3D Analyst.
- Click Close.
Previewing 3D data in ArcCatalog
Before you drape the image, you’ll browse to the terrain data and preview it in ArcCatalog.
Steps:
- Navigate to the 3DAnalyst folder connection in the Catalog Tree.
- Double-click 3DAnalyst.
- Double-click Exercise1.
- Click Death Valley Terrain.
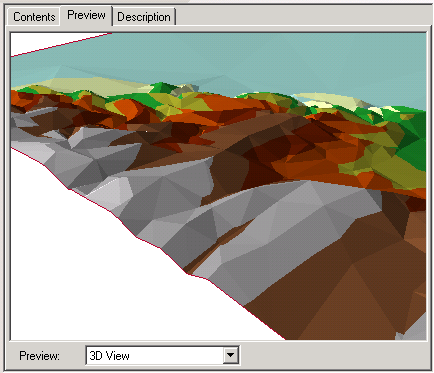
- Click the Preview tab. You can preview your GIS data in ArcCatalog. With 3D Analyst installed, you can also preview some data in three dimensions.
- Click the Preview drop-down arrow and click 3D View.
- Right-click above the preview window and click 3D View Tools.
- Click inside the 3D preview and drag to the right.
- Right-click the 3D preview and drag down.
- Click the middle button—or both the right and left buttons if you have a two-button mouse—and drag to the right.
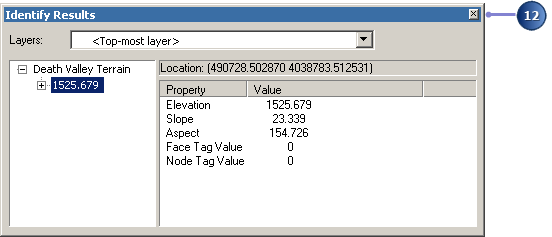
- Click the Identify
 button and click on the TIN.
 - Close the Identify Results window by clicking the top right x.
- Click the Full Extent
 button.
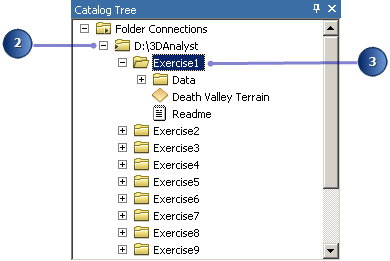
You see a folder called Data and a TIN layer called Death Valley Terrain.
A layer is a shortcut to geographic data. It also stores information about how the geographic data should be drawn on a map or in a 3D view.
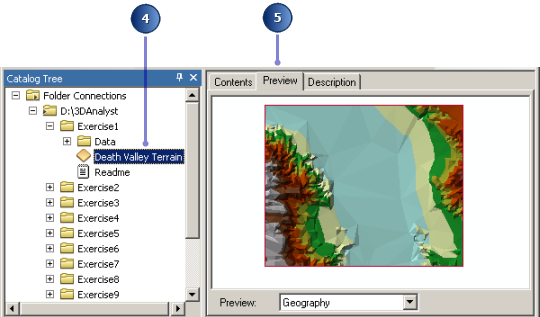

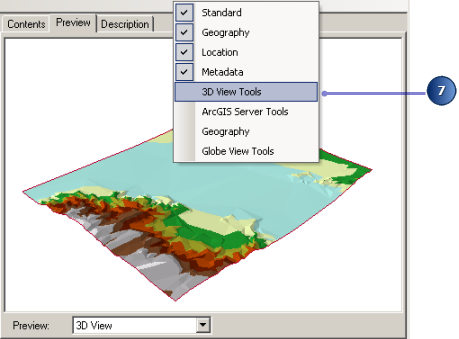
The preview becomes a 3D preview, and a new set of tools appears on the 3D View Tools toolbar.
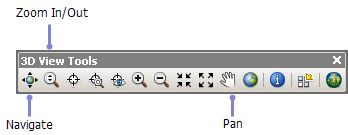
 tool is active when you first preview data in 3D. You can see the names of tools by hovering the pointer over the tool.
The Navigate tool allows you to rotate 3D data and change the apparent viewer height by clicking and dragging left and right and up and down, respectively, in 3D preview.
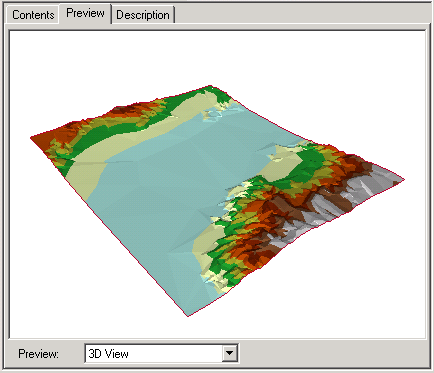
The data rotates around its center. The Navigate tool also allows you to zoom in and out and pan across the data, depending on the mouse button that you click while dragging in the 3D preview.
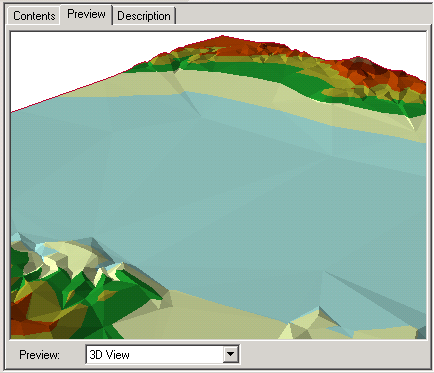
The pointer changes to the Zoom In/Out  pointer, and the view zooms in to the data.
 pointer, and the view zooms in to the data.
The pointer changes to the Pan  pointer, and the view pans across the data.
 pointer, and the view pans across the data.
The Identify Results window that appears shows you the elevation, slope, and aspect of the surface at the point you clicked.

The view returns to the full extent of the data.
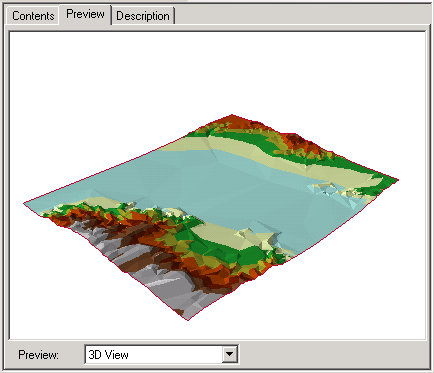
Now you’ve examined the surface data and begun to learn how to navigate in 3D. The next step is to start ArcScene and add your radar image to a new scene.
Starting ArcScene and adding data
ArcScene is one of two 3D visualization environments for 3D Analyst (ArcGlobe is introduced in Exercises 5 and 6). Although you can preview 3D data in ArcCatalog, ArcScene allows you to build up complex scenes with multiple sources of data.
Steps:
- From ArcCatalog, click the ArcScene
 button on the 3D View Tools toolbar to launch the application.
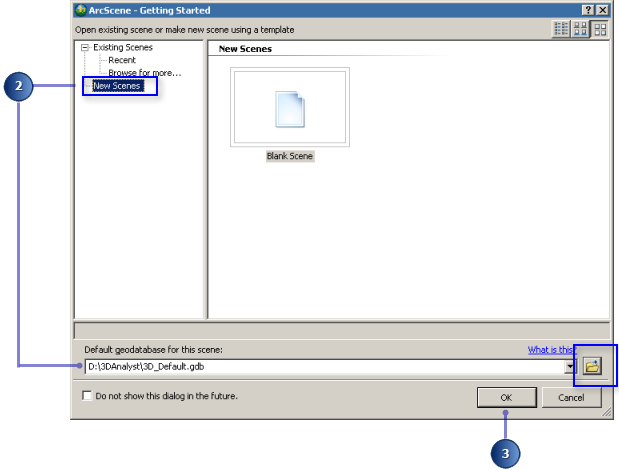
 - In the ArcScene - Getting Started dialog box, click New Scenes and click the Browse
 button to set the default geodatabase path to D:\3DAnalyst\3D_Default.gdb.
 - Click OK to close the Getting Started dialog box.
- Close ArcCatalog.
- On the right side of the ArcScene window, move your pointer over the Catalog tab or click the Catalog tab
- Navigate to the Exercise1 folder in the Folder Connections path where you locally saved the tutorial data.
- Click the Death Valley Terrain layer and drag it into the 3D view area of ArcScene, then release the mouse button.
- Navigate to the Data folder inside Exercise1 from the Catalog window.
- Click the dvim3.TIF layer and drag it into the 3D view of ArcScene, then release the mouse button.
- Uncheck the Death Valley Terrain layer.

This location will be used for output spatial data generated in the tutorial exercises.
Note that many of the tools on the ArcScene Standard toolbar are the same as the 3D navigation tools that you see in ArcCatalog.
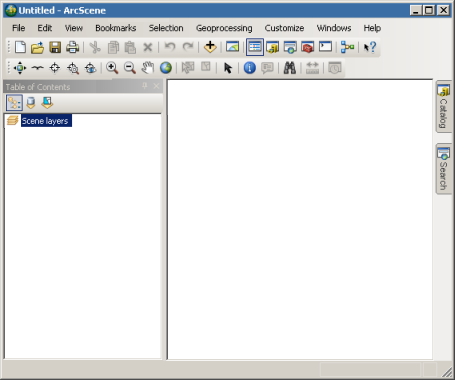
The Catalog window slides into the view, ready for use.
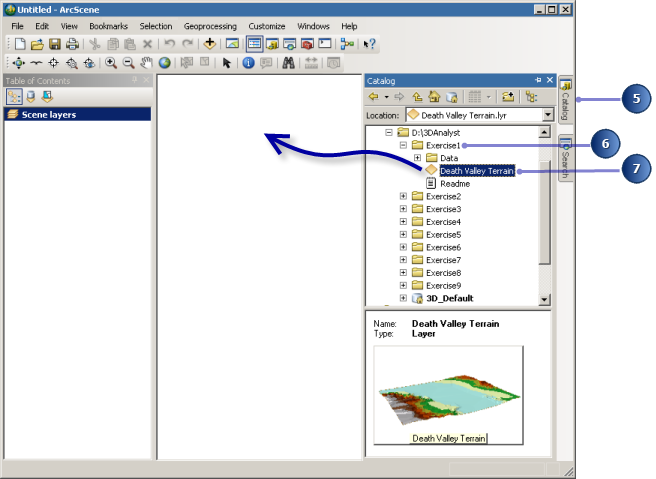
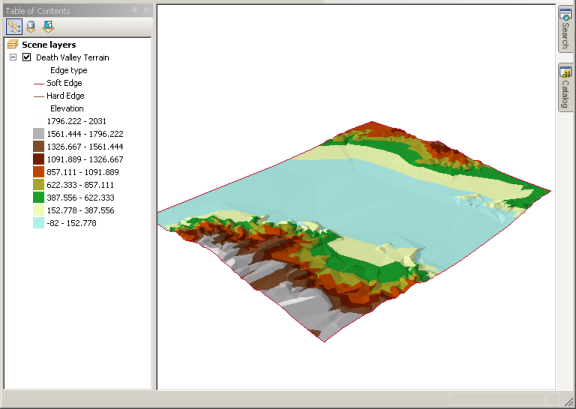
The TIN is drawn in the new scene, and the TIN layer is automatically added into the table of contents.
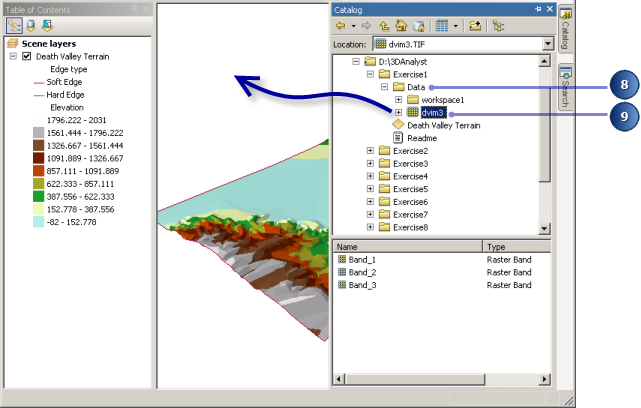
The image is added to the scene.
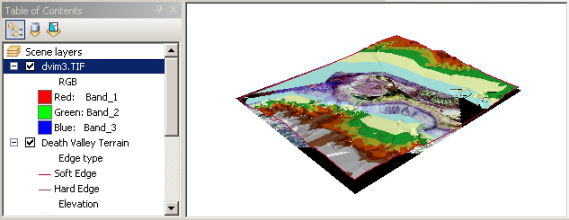
The image is drawn on a plane, with a base elevation value of zero. You can see it above the Death Valley terrain surface where the terrain is below 0 meters elevation (sea level); it is hidden by the terrain surface everywhere else.
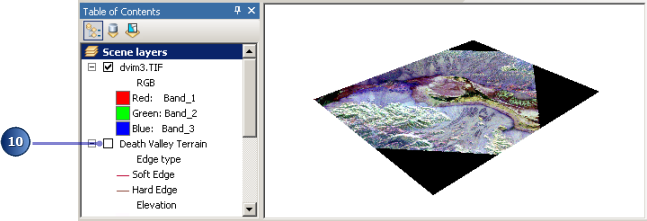
Now you can see the whole image. The black areas are parts of the image that contain no data and are a result of previous processing to fit the image to the terrain.
You have added the image to the scene. Now you will change the properties of the image layer so that the image will be draped over the terrain surface.
Draping the image
While the surface texture information shown in the image is a great source of information about the terrain, some relationships between the surface texture and the shape of the terrain will be apparent when you drape the image over the terrain surface. In ArcScene, you can drape a layer— containing a grid, image, or 2D features—over a surface (a grid or TIN) by assigning the base heights of the layer from the surface.
Steps:
- Right-click dvim3.TIF in the ArcScene table of contents and click Properties.
- Click the Base Heights tab.
- Click the option Floating on a custom surface.
- Click OK.
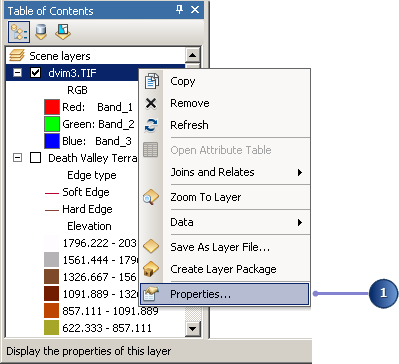
The Layer Properties dialog box appears. You can change how a layer is drawn on a map or in a scene by setting its properties.
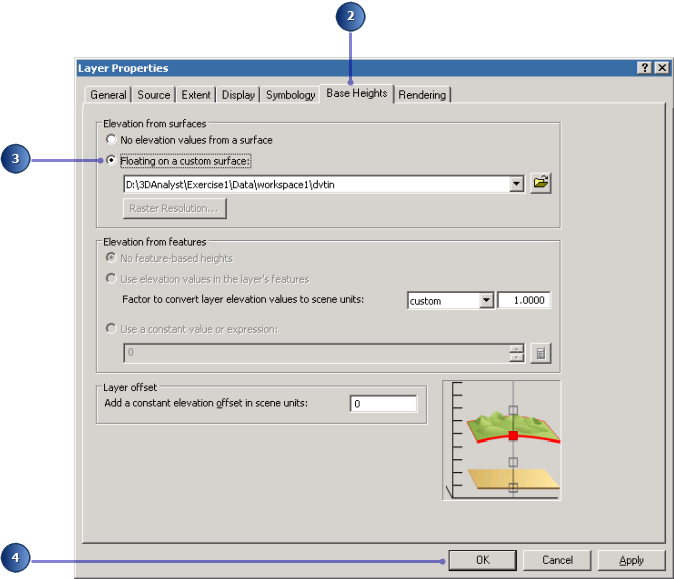
Because the TIN is the only surface model in the scene, it appears in the surface drop-down list.
The image is draped over the terrain surface.
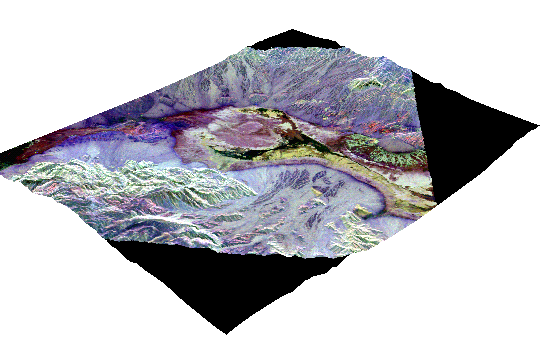
Now you will be able to navigate around the image and see the relationship between surface texture, as shown by the image colors, and the shape of the terrain.


0 commentaires