The town of Horse Cave, Kentucky, is situated above a cave that once served as the source of drinking water and hydroelectric power for the town. Unfortunately, the groundwater that flows in the cave was polluted by household and industrial waste dumped on the surface and washed into sinkholes. Dye-tracing studies and a three-dimensional survey of the cave revealed the relationship between the cave passages and the town and demonstrated the connection between open surface dump sites and contamination of the groundwater in the cave below.
Thanks to the development in 1989 of a new regional sewage facility and the joint efforts of the Cave Research Foundation and the American Cave Conservation Association (ACCA), the groundwater is cleaner, and the cave has been restored. It is now operated as a tour cave and educational site by the ACCA.
Cave data was provided courtesy of the ACCA.
Viewing the cave and the landscape
First, you will open the BuildTIN scene and view the cave survey and some terrain data layers. You’ll use this terrain data to create a TIN and drape some other layers on it to visualize the relationship of the cave to the town.
Steps:
- Start ArcScene by clicking Start > All Programs > ArcGIS > ArcScene 10.
- On the ArcScene - Getting Started dialog box, click Existing Scenes --> Browse for more.
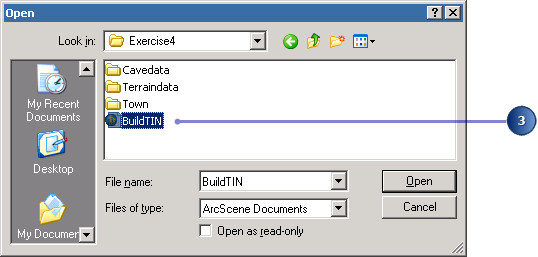
- Navigate to the Exercise4 folder and double-click the BuildTIN ArcScene document.
- Check the box to show the Cavesurvey layer.
- Right-click Cavesurvey and click Zoom To Layer.
If you already have ArcScene open from the previous exercise, simply click File and click Open.
The Open dialog box appears.
The scene opens, and you can see the location of roads and railroads, some sample elevation points, and a few significant contour lines. In the table of contents, you can see that some layers have been turned off.
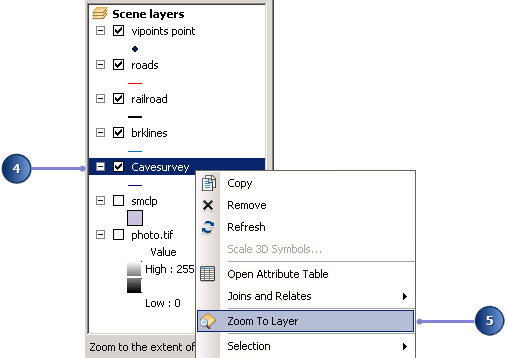
The cave survey data consists of PolylineZ features, which are automatically drawn in 3D because they have z-values embedded in their geometry. They appear above the rest of the data because all the other layers are drawn with the default elevation of 0.
In the next steps, you will build a TIN using geoprocessing tools to provide the base heights for the streets and a photo of the town.
Creating a TIN from point data
You have a point layer called vipoints point. This coverage consists of points with an attribute called SPOT that contains elevation values taken at these points. You’ll create the TIN surface model from these points using the Create TIN geoprocessing tool.
When using geoprocessing tools, you will see a progress bar at the bottom of your document displaying the name of the currently executing tool. When the tool finishes executing, a pop-up notification will appear on the system tray. This is called background geoprocessing which, by default, is turned on when the software is installed and opened. To disable background geoprocessing, use the Geoprocessing Options dialog box from the Geoprocessing main menu.
Steps:
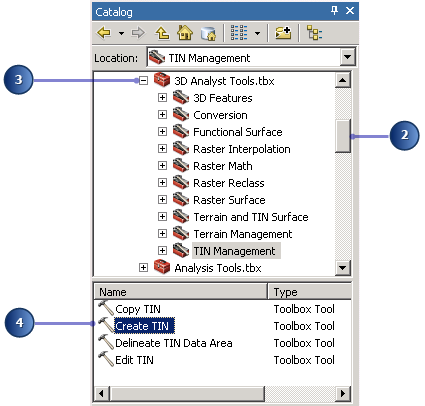
- Click the Catalog tab to expand the Catalog window into the view.
- Scroll to find Toolboxes.
- Expand Toolboxes, click System Toolboxes, then choose the 3D Analyst Tools toolbox.
- Navigate to the TIN Management toolset and double-click the Create TIN geoprocessing tool.
- Click the Browse button to set the Output TIN location.
- Click the Home
 button, double-click the Terraindata folder, then change the output TIN name to tin1 and click Save.
 - Click the Input Feature Class drop-down list and click vipoints point.
- Click OK.
- Right-click the tin1 layer in the table of contents and click Properties.
- Click the Symbology tab.
- Click the Add button to open up the Add Renderer dialog box.
- Click the Face Elevation with graduated color ramp option and click Add.
- Click Dismiss to close the Add Renderer dialog box and return to the Layer Properties dialog box.
- Switch off the original single color renderer by unchecking the Faces checkbox in the list of renderers.
- Click OK to close the Layer Properties dialog box.
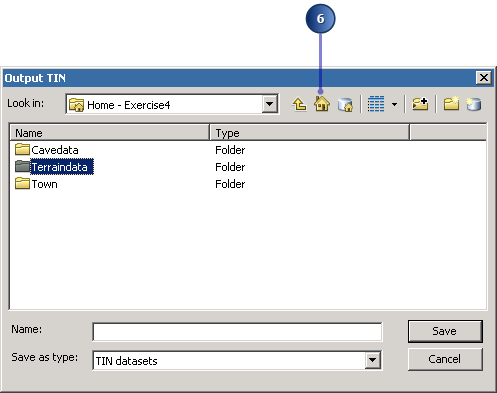
Confirm that the Output TIN location is set to the Home - Exercise4 folder.
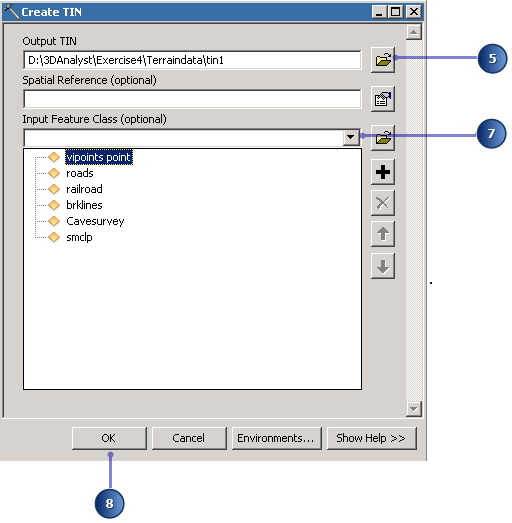
The SPOT field name appears in the height_field column, and the layer will be triangulated as mass points.
The TIN is created and added to the scene. Note that it is drawn above the Cavesurvey layer; the elevation values in the TIN define its base height.
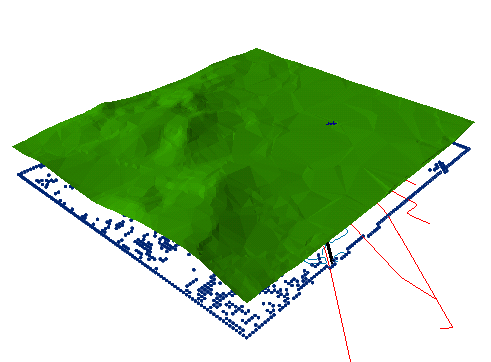
By default, the TIN is symbolized using a single color for every face.
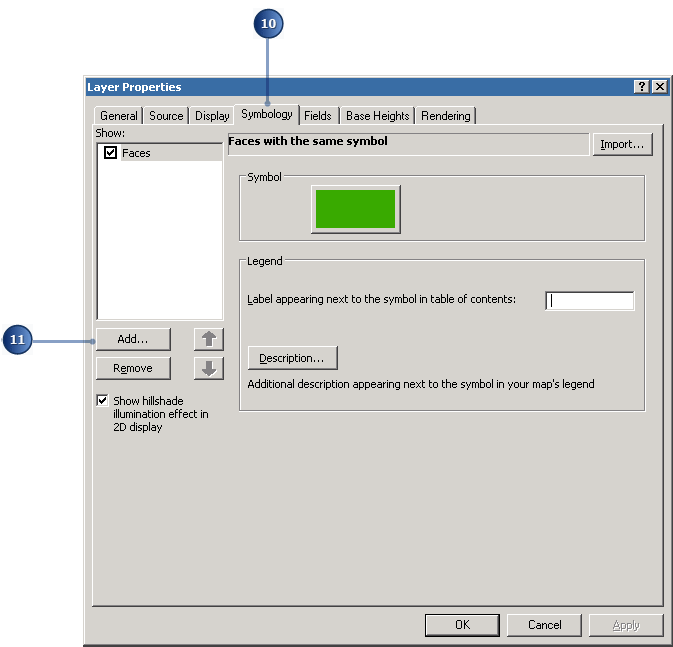
You can see there is a single renderer in place, titled Faces.
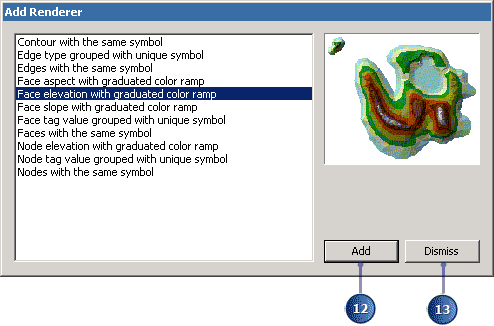
If the symbol for the highest elevation range is set to blue instead of white, then right-click on any of the symbols and click Flip Symbols.
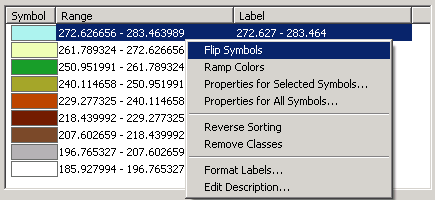
This will switch the order of the symbols and render the highest points of the TIN as snow-capped peaks.

While this TIN is a fairly good model of the surface, you can make it more accurate by adding more features.
Adding features to a TIN
Now you will add hard and soft breaklines and a clip polygon to the TIN. You’ll add the railroad features as soft breaklines, so they’ll be represented on the surface but won’t influence the shape of the surface. You’ll add the brklines features as hard breaklines with elevation values to refine the shape of the surface in areas that you’re most interested in. Finally, you will add the smclp polygon as a soft clip polygon to more smoothly define the edge of the TIN.
Steps:
- From the Catalog window, scroll to find Toolboxes.
- Expand Toolboxes, click System Toolboxes, then click the 3D Analyst Tools toolbox.
- Navigate to the TIN Management toolset and double-click the Edit TIN geoprocessing tool from the bottom window.
- Click the Input TIN drop-down list and click tin1.
- Click the Input Feature Class drop-down list and click railroad.
- Click the height_field drop-down arrow and click <None>.
- Click the SF_type drop-down arrow and click softline.
- Click the Input Feature Class drop-down list and click brklines.
- Click the Input Feature Class drop-down list and click smclp.
- Click the height_field drop-down arrow and click <None>.
- Click OK.
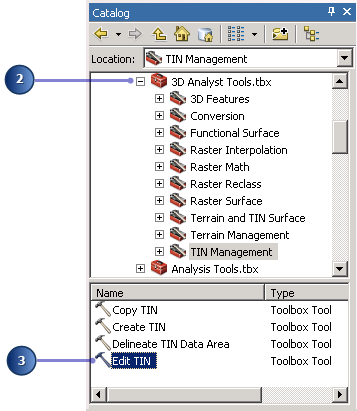
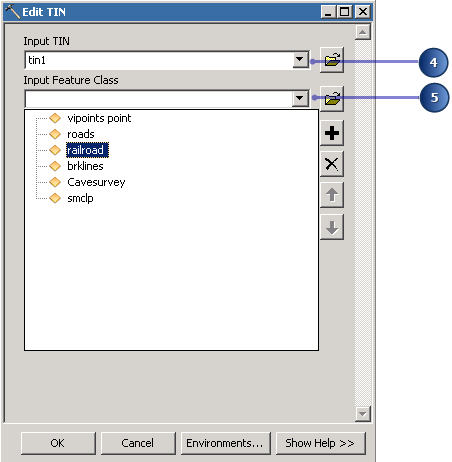
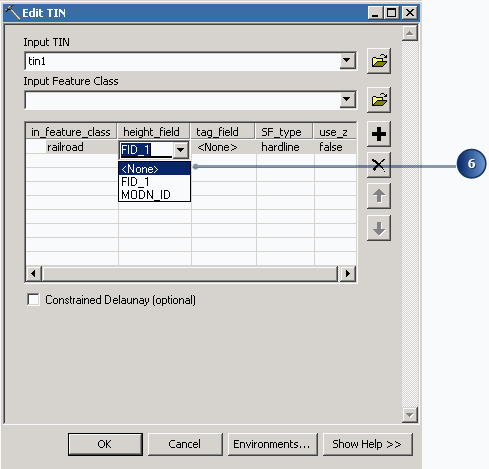
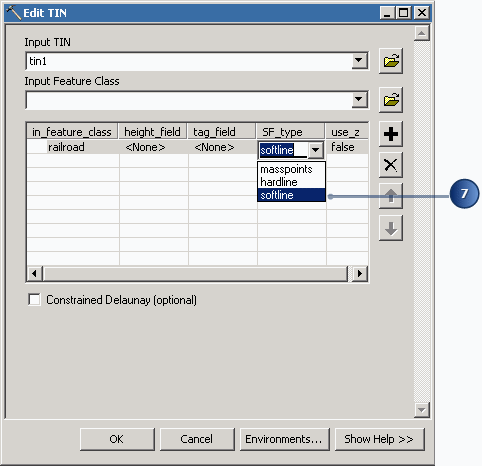
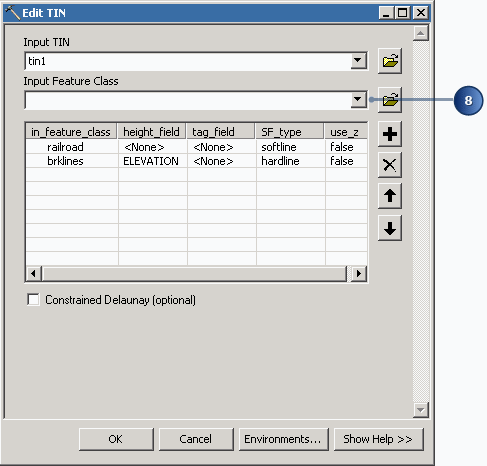
The Edit TIN tool detects that there is an ELEVATION field and uses it for the height source. You will accept the default and triangulate them as hard breaklines.
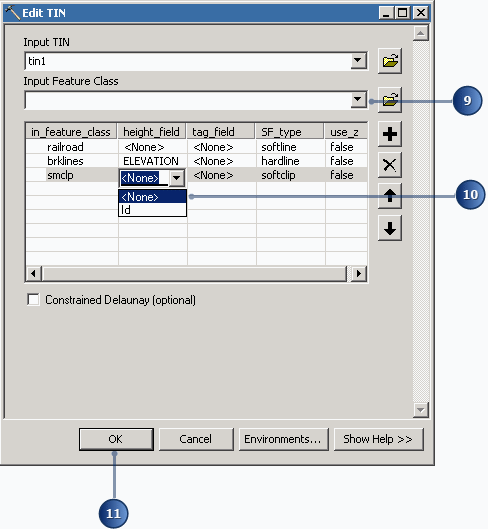
You have defined the feature layers that you want to add to your TIN and specified how they should be integrated into the triangulation.
The new features are added to the TIN.
After the next step, you will see that the railroad follows a bed that has been leveled somewhat relative to the surface.
Setting feature base heights from the TIN
Now you will set the base heights for the road and railroad features from the new TIN.
Steps:
- Right-click roads and click Properties.
- Click the Base Heights tab.
- Click Floating on a custom surface.
- Click the drop-down arrow and click tin1.
- Click OK.
- Right-click railroad and click Properties.
- From the Base Heights tab, click Floating on a custom surface.
- Click OK.
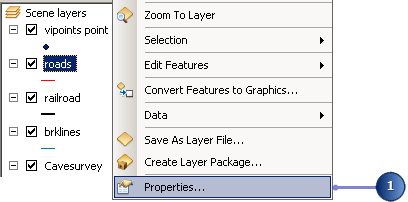
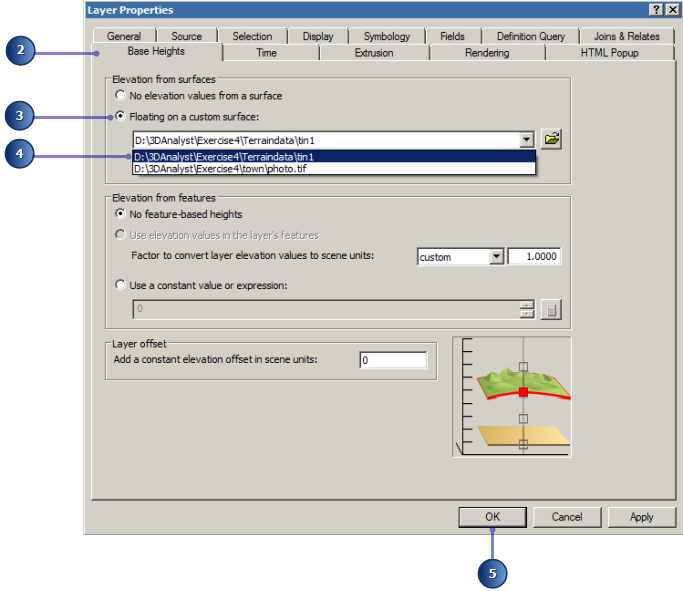
The road features are now draped over the TIN surface that you created. Now you will drape the railroad features over the surface.
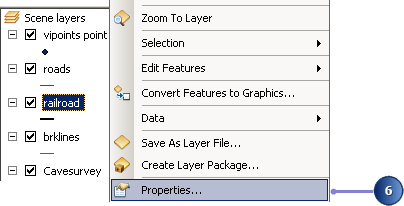
The elevation surface is already set to tin1.
The railroad features are now draped over the TIN surface that you created.
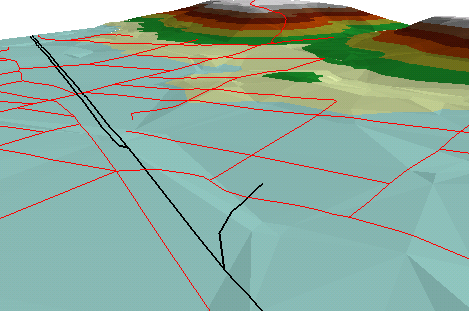
Next you’ll drape the aerial photo over the TIN.
Setting raster base heights from the TIN
Including the aerial photo of the town in the scene makes the relationship between the cave and the town much more evident. You’ll drape the raster over the TIN and make it partly transparent so that you’ll be able to see the cave beneath the surface.
Steps:
- Right-click photo.tif and click Properties.
- Click the Base Heights tab.
- Click Floating on a custom surface.
- Click the drop-down arrow and click tin1.
- Click the Display tab.
- Type 30 in the Transparency text box.
- Click OK.
- Check photo.tif in the table of contents so it becomes visible in the scene.
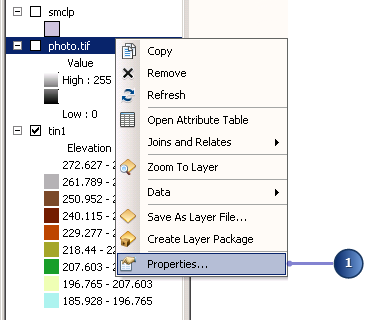

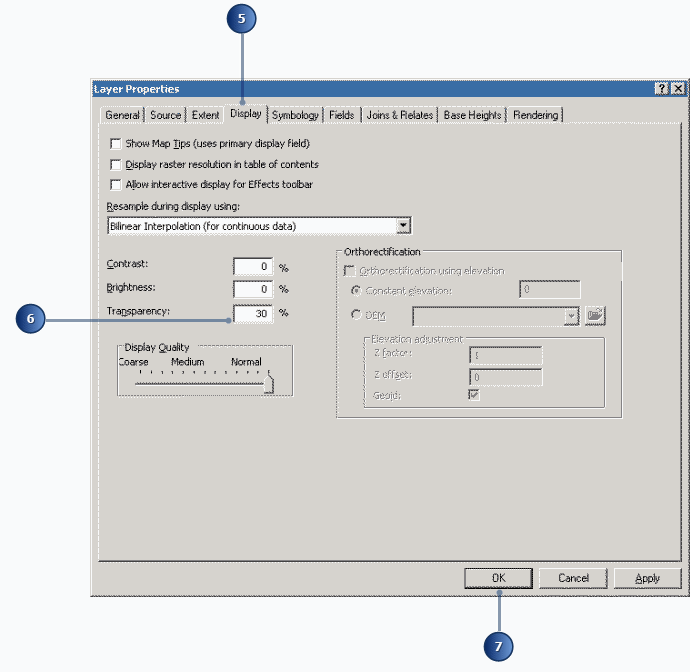
Now the aerial photo is 30 percent transparent. You can see large patches of the TIN over the photo because the TIN and the photo have the same drawing priority. If you wanted the TIN to be visible below the photo, you could change its drawing priority to 10 (lowest) on the Rendering tab of the TIN's Layer Properties dialog box. You could also offset the base height of the TIN or the photo by a small amount.
Cleaning up the scene
To clean up the scene, you'll turn off the visibility of some layers that are no longer needed and make the cave line symbol larger.
Steps:
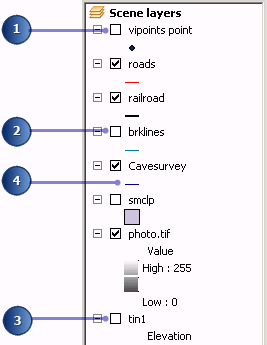
- Uncheck vipoints point.
- Uncheck brklines.
- Uncheck tin1.
- Click the line symbol for the Cavesurvey layer.
- Type 5 in the Width box.
- Click OK.
In the table of contents, do the following:
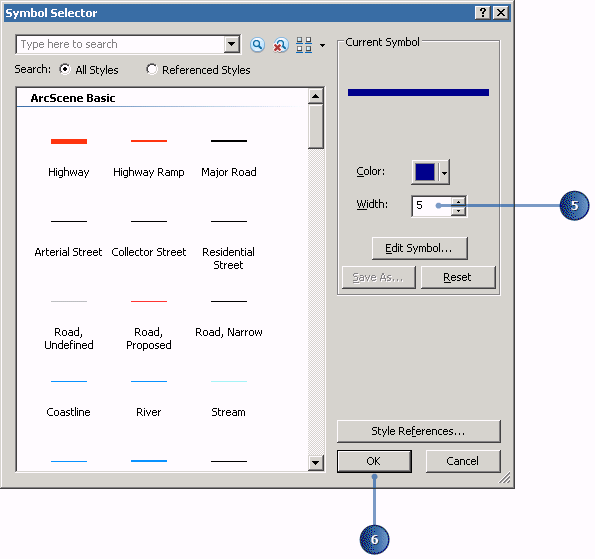
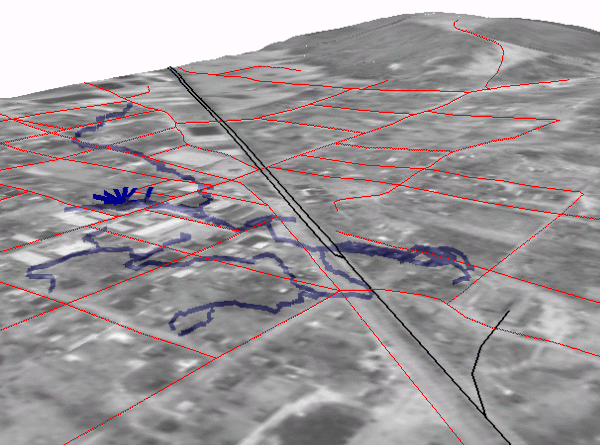
Now you can see the three-dimensional passages of the cave, symbolized by thick lines. The surface features and the aerial photo provide context, so you can easily see the relationship of the cave to the town as you navigate the scene.
Creating a profile of the terrain
The cave follows the valley floor orientation. To get an understanding of the shape of the valley, you will create a profile across the TIN. To create a profile, you must first have a 3D line (feature or graphic). You will start ArcMap, add the TIN to the map, and digitize a line to make your profile.
Steps:
- Start ArcMap by clicking Start > All Programs > ArcGIS > ArcMap 10.
- On the ArcMap - Getting Started dialog box, select New Maps and then click Browse
 to set the default geodatabase path to D:\3DAnalyst\3D_Default.gdb.
 - Click OK to close the Getting Started dialog box.
- Click Customize, point to Toolbars, and click 3D Analyst.
- Click Customize and click Extensions.
- Check 3D Analyst if it's not already.
- Click Close.
- Open the Catalog window and navigate to the Exercise4\Terraindata folder in the Folder Connections path where you locally saved the tutorial data.
- Click the tin1 layer and drag it into the map view, then release the mouse button.
- From the 3D Analyst toolbar, click the Interpolate Line
 button.
 - Click the upper-left corner of the TIN, drag the line to the lower-right corner, and double-click to stop digitizing.
- Click the Profile Graph Tool
 button.
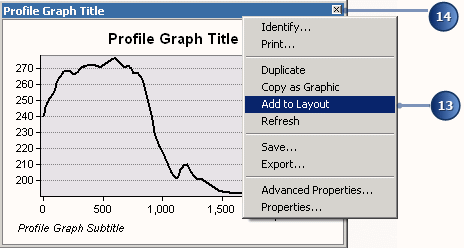
 - Right-click the Profile Graph Title bar and click Add to Layout.
- Close the Profile Graph window.
- Click the Data View
 button to return to data view.
This location will be used to store output spatial data generated in the tutorial exercises.
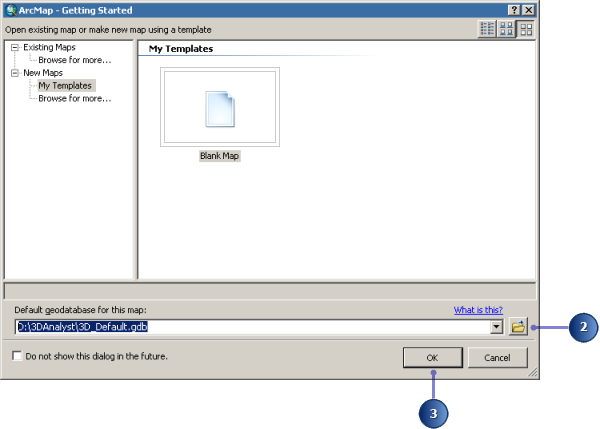
ArcMap finishes opening.

Now you will add the 3D Analyst toolbar to ArcMap. The ArcMap 3D Analyst toolbar contains many tools that do not appear on the ArcScene 3D Analyst toolbar. Two of these are the Interpolate Line tool and the Create Profile Graphtool, which you will use to create your profile of the surface.
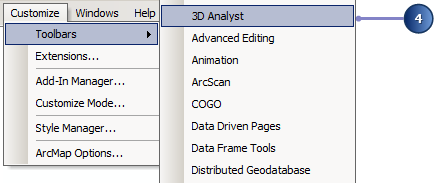
The 3D Analyst toolbar appears.
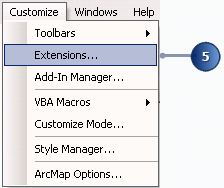
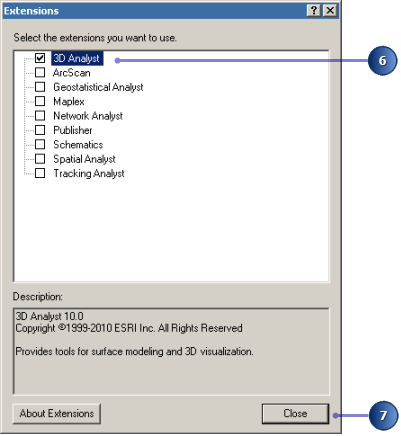
The 3D Analyst extension is enabled.
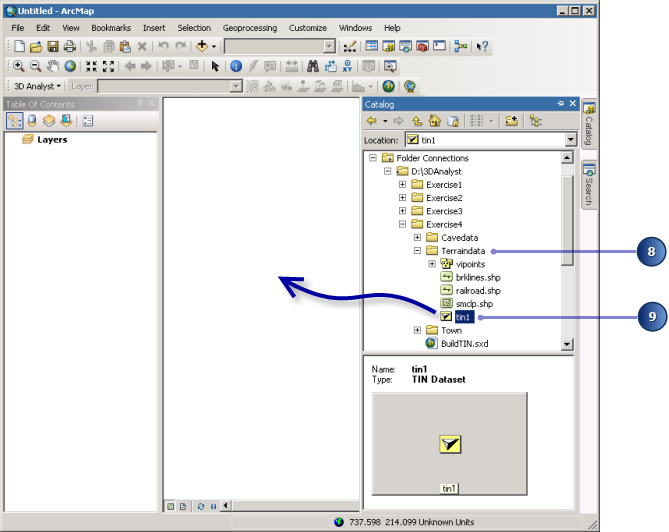
If prompted, click OK to close Unknown Spatial Reference warning message box.
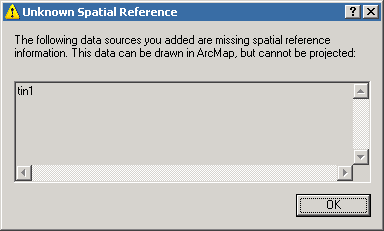
The TIN is drawn in the new scene, and the TIN layer is automatically added into the table of contents.
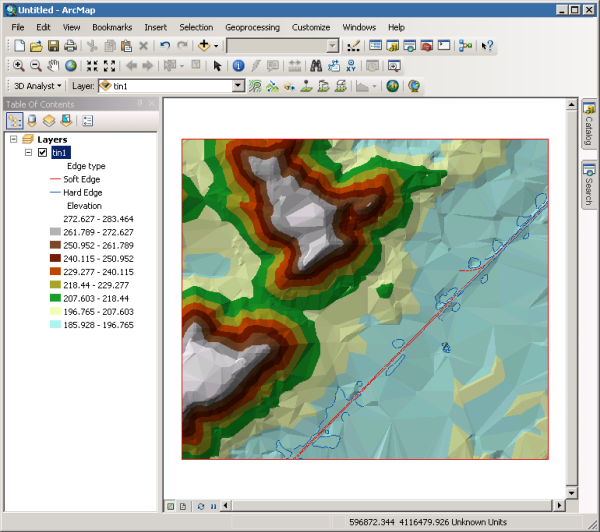

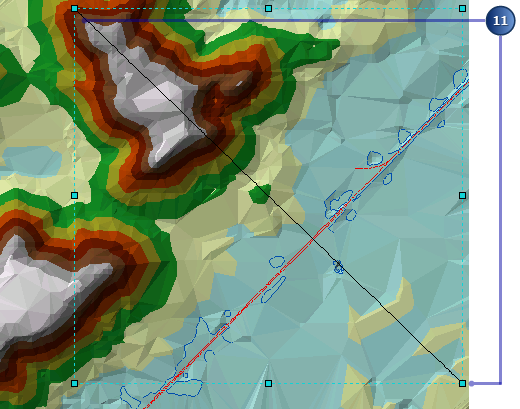
You can create a profile along a line with more than one segment, but in this case you’ll just make one straight line.
The profile graph is created.
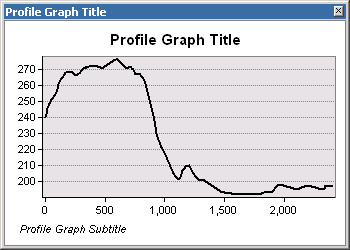
You can edit the title, subtitle, and other properties of the graph; save, print, or export the graph; copy it to the clipboard; and show the graph on the layout. You can also simply close the graph.
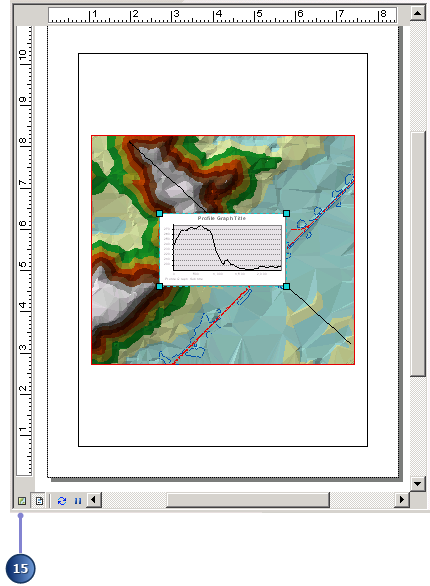
The view automatically switches to Layout View. You can see the different view icons change in the bottom of the display.
You can see the graph on the layout of the map.
Creating a line of sight on the terrain
Another way of understanding the terrain is to create a line of sight. Lines of sight show what parts of a surface are visible and what parts are hidden along a line from an observer's point to a target point.
Steps:
- Click the Create Line of Sight
 button.
 - Type 2 in the Observer offset text box.
- Click on the south slope of the higher land in the upper right part of the TIN (the observer point), drag the line to the lower-right part, and release the mouse button (the target point).
- Close the Line Of Sight dialog box.
- Click Edit and click Select All Elements.
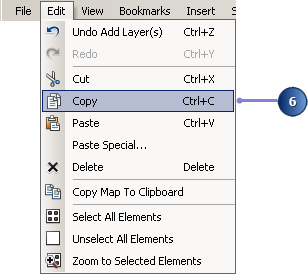
- Click Edit and click Copy.
- Switch back to ArcScene and click Edit, then click Paste.
- Click the Save
 button in ArcScene.
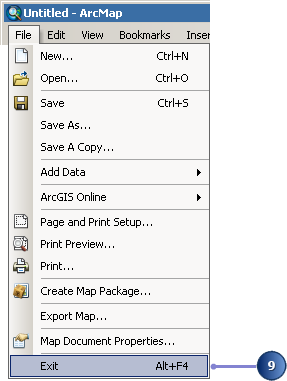
 - Click File in ArcMap and click Exit.
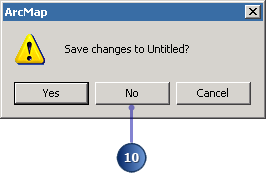
- Click No to saving changes and close ArcMap.
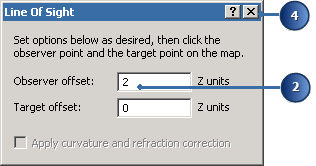
The line of sight will be calculated to show what is visible from the perspective of an observer two meters tall, as the z-units for this scene are meters.
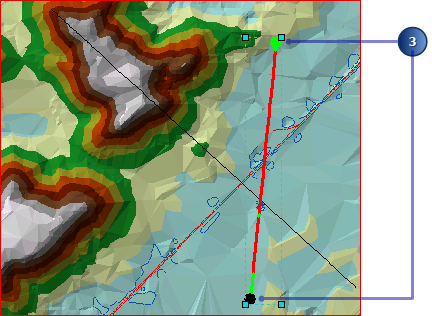
The line of sight is calculated. The green segments show areas that are visible from the observer point; the red segments are hidden from the observer.
Lines of sight, like other graphic lines, can be copied from ArcMap to ArcScene. Now you will copy both the lines you've created into the scene.
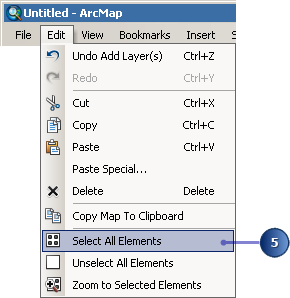
Both of the lines you created are selected.
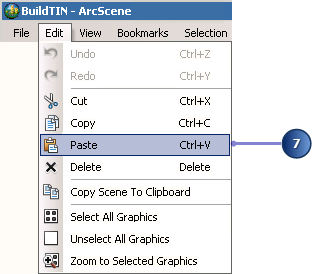
The lines are pasted into the scene.
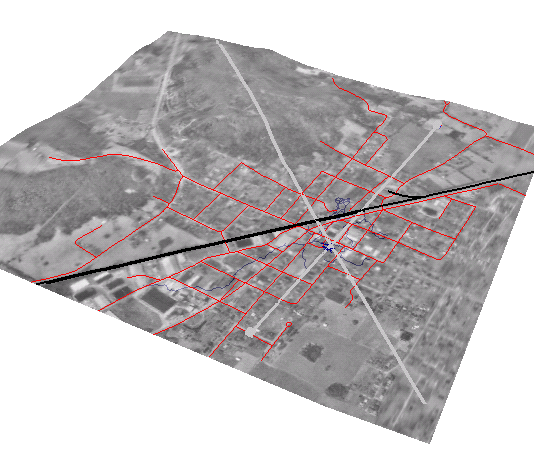
If necessary, to deselect the pasted lines, click away from the lines somewhere else in the scene to unhighlight them.
In this exercise, you learned how to create and work with a TIN surface model using ArcScene and ArcMap. You discovered how to construct and symbolize a TIN dataset to accurately represent a 3D surface. Breaklines and polygons were added to additionally depict surface features, such as railroads and terrain elevation values. Further surface analysis was then conducted using aerial photography as a draped raster layer on the TIN. Finally, you completed the exercise conducting 3D surface analysis on the TIN model using the interpolate line and create profile graph tools in ArcMap.
Now that you've learned how to represent a surface using a TIN model, you can begin to explore other areas of the ArcGIS 3D Analyst extension. In the next exercise, you will learn how to create and work with animations in ArcGlobe.


0 commentaires