

ArcGIS is a geographic-information-system (GIS) developed by ESRI. Being widely used and the sheer amount of functions and add-ons are maybe the important causes for being a big-player at universities as well. Therefore we will present you some basic tutorials for learning an enjoying ArcGIS:
objective
To connect a scanned map with other geographical data the map needs to be refrenced. This meens, that every pixel in the scanned image gets a new dimension: besides its location in the image (e.g. 326th pixel from left and 124th pixel from the top) it gets a real-world coordinate as well (e.g. 45°32′ and 16”N 120°37’11”W ).
The objective of this tutorial is to show you how to translate these pixel-coordinates in real-world coordinates, aka. georeferenciation
what do you need
ArcGIS 10, 9.3, 9.1, etc. a scanned map availbale as *.tif or *.jpg (other flavours can be used as well, but should be ratser)(we’ve used a topographic map 1:25.000 (4521) distributed by the “Hessisches Landesvermessungsamt” (1983)
Time effort : about 10 mins
step 1: define a projection
In the first step we need to define a projectionfor the map: so the same term is also the function in ArcGIS: Define Projection (Abb.1).
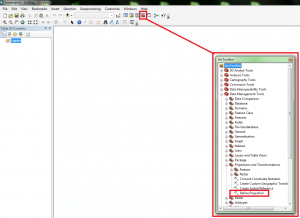
Fig.1 Location of „Define Projection“ in the ArcGIS Toolbox
In the tool Define Projection we choose the scanned map as Input Dataset (Fig.2 red 1.) and the coordiante system that is defined in the description of the map (Fig.2 red 2.).
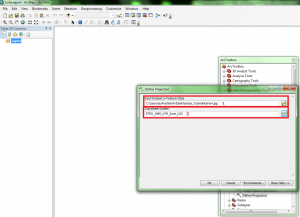
Fig. 2 Input of parameters
step 2: preparation of the georeferenciation
Now we need to adjust the visibility of the Georeferencing Toolbar. Look at Fig. 3 an follow the four steps.
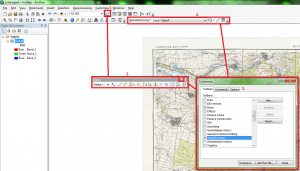
Fig.3 Add the Georeferencing Toolbar
First open the Editor (red 1.). There we choose Toolbar options ->Customize (red 2.) and a list with availabletoolbars will be opened (rot 3.). Now search for the Georeferencing and check it. The Toolbar shows up in your working window (red 4.).
step 3: georeferencing
Zoom to the upper left edge of the map and search for a crossing of a longitude and latitude. Now create a point on this cross using the function Add Control Points (Fig.4 red 1.). After marking the point use a right-click (red 2.) and choose the option Input X and Y: a window will open (red 3.) where you can record your pairs of input and output coordinates. Record the values that belongs to the latitude and longitude as Y- and X-value. Do this for the other three edges of the map as well! if you don’t want to struggle with auto-projection use always opposing pairs (lower left, upper right, upper left, lower right).
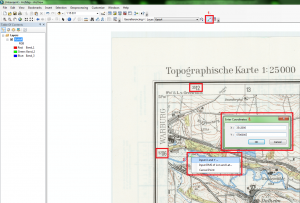
Fig.4 adding control-points
As the transformation we will use 1st Order Polynomial (look here: Georeferencing->Transformation. The result of the transformation needs to be exported (Fig.5) using a right-click on the layer: Data->Export Data. It is important to give a name, file format and the storage place for the resulting raster in the Export Data dialogue.
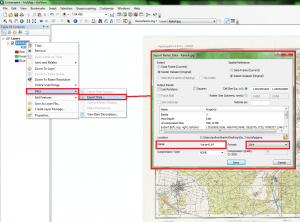
Fig.5 export as TIFF
step 4 – quality control
As a minimal quality control you should compare the coordinates of the map and the shown coordinates on the program. The “new” coordinates will eb shown on the lower right part of the working window. If they match you have done everything right.


0 commentaires